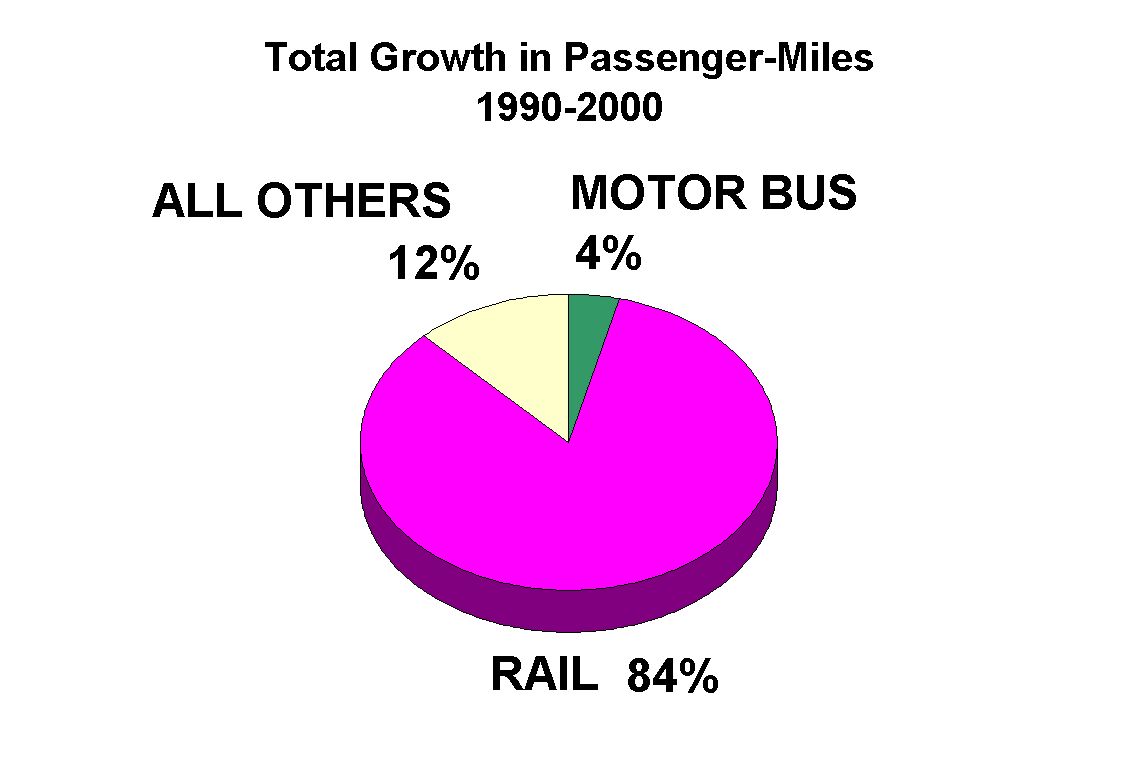
Chart from paper shows overwhelming role of rail transit in contributing to growth of public transportation passenger-mileage.
♦
by Lyndon Henry
A very curious argument is occasionally brought to bear against urban rail plans and projects — the claim that rail transit somehow has a class and ethnic bias favoring relatively affluent ethnically white segments of the population. This is particularly curious because, in a given city, the rail opponents that promulgate this contention — often trying to stoke public discontent or voter rejection of a ballot measure — will raise this fear among less affluent and predominantly minority neighborhoods, with a high percentage of residents more dependent on good transit service (which rail excels in providing). But then the same opponents will go to the opposite side of town and raise totally opposite fears among relatively more affluent ethnically white neighborhoods — urban rail will bring “those people” (supposedly, low-income minorities) into your neighborhood!
It’s ugly, it’s contradictory, but it does seem to work for rail opponents … up to a point.
Taking the “class/ethnic bias” attack on urban rail head on, back in July 2006 I presented a paper on this very issue to the 2006 National Meeting of the Conference of Minority Transportation Officials (COMTO), held that year in Austin, Texas (where I was then a data analyst for Capital Metro, the transit authority). I coined the term “rainbow ridership” to express the concept of ethnic and income diversity in transit ridership:
At the conference session, I also presented a PPT summarizing the paper.
The specific research question addressed in the paper is fairly simple:
Transit services, and major new transit system investments, such as rail transit, are typically aimed to fulfill several important types of travel needs. Two of the most pre-eminent of these needs are:
(1) Providing a basic, affordable service for transit-dependent travelers, many of whom are lower-income, or mobility-impaired because of handicaps, age, or other factors;
(2) Providing a high-quality service fashioned to attract more affluent urban and suburban travelers out of their motor vehicles, thus helping to alleviate dependency on private motor vehicle transportation and to reduce demand for peak roadway and parking capacity.
These differences reflect the contrasting needs of the demographically diverse population mix typical of North American urban areas today. But how well are these somewhat disparate needs being fulfilled?
Discussing several examples of how the “rail favors affluent whites” argument is wielded to try to stymie urban rail development plans and projects, the paper notes that
The portrayal of some kind of class and ethnic differentiation among transit modes — bus for the poor and nonwhite, rail for the rich and white — is highly dubious and certainly unsupported by evidence. The decision to install a higher-quality mode such as rail transit – or a busway, for that matter — is motivated by factors such as the desire to improve services for the riding public, to ameliorate environmental impacts, to facilitate greater efficiencies in transit operation, and to reduce the unit cost of transit service. Overwhelmingly, these goals are being achieved, and these benefits are being brought to very broad range of existing transit users as well as new riders attracted to the improved service.
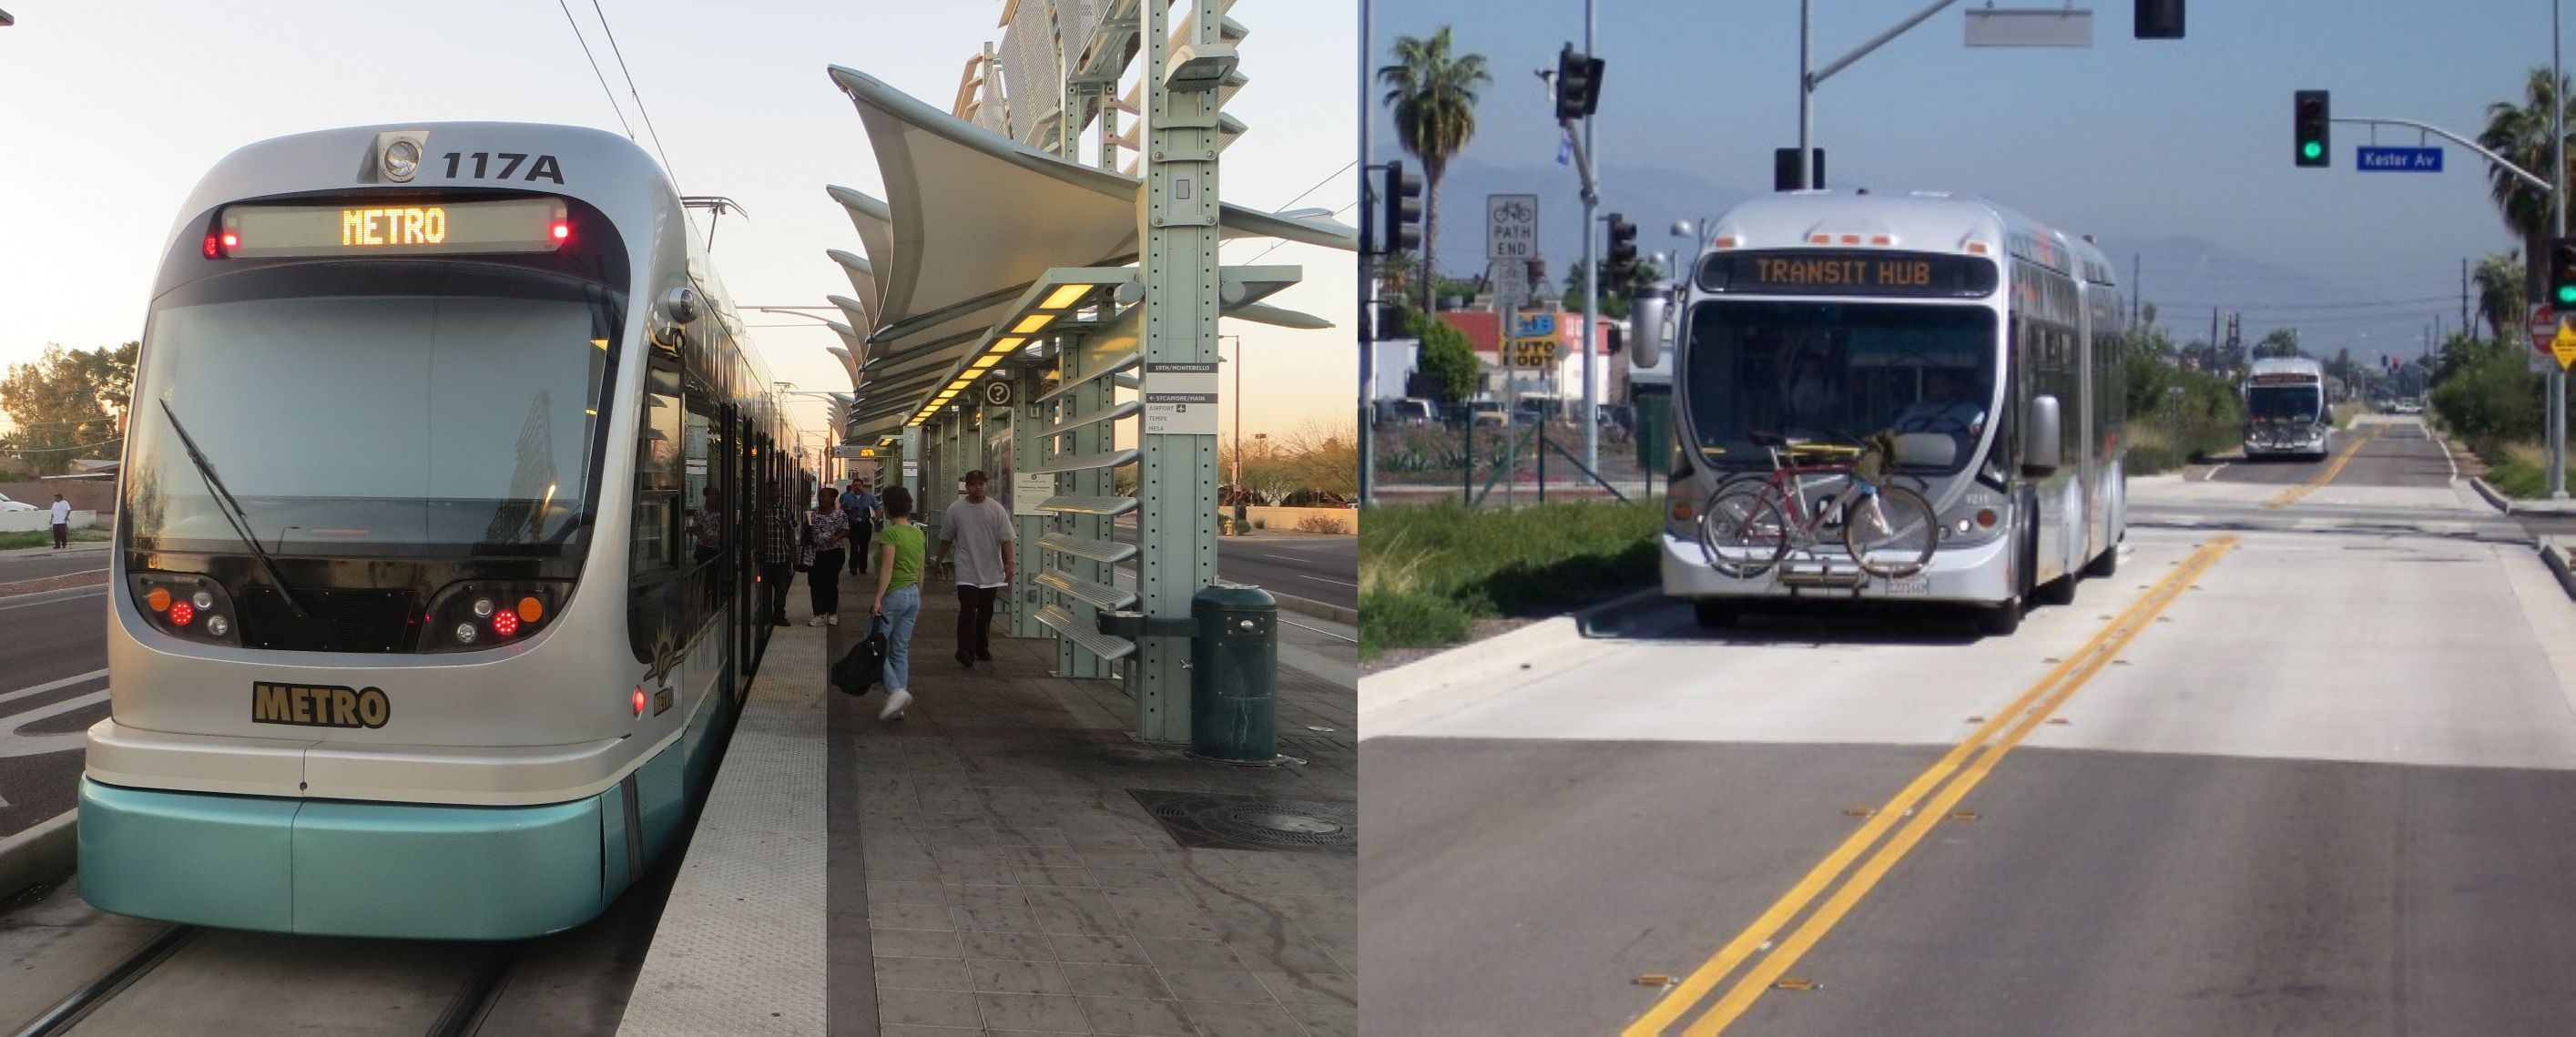
In reality, rail systems appear to attract a far more diverse ridership, particularly with respect to ethnic background and income level, than do typical bus services. Inevitably, this implies that, for a given rail service in a specific corridor, a proportionately higher number of white/anglo and more affluent passengers will be attracted – even if the number of nonwhite, lower-income, and transit-dependent riders is equal to, or greater than, what would otherwise by carried by bus operations in the corridor.
For supporting evidence, the paper draws upon fact-based articles from the Light Rail Now website:
• Light Rail and Lower-Income Transit Riders
• Does Light Rail “Rob” Bus Service, or Make It Prosper? You Decide!
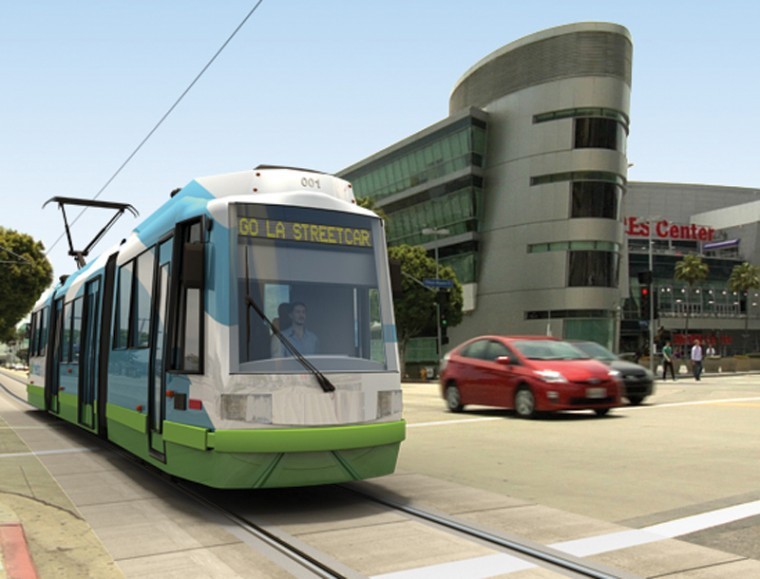
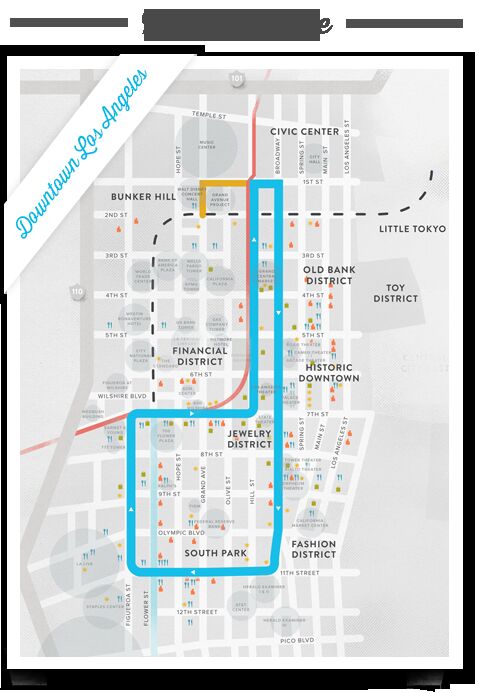
My paper also supports its thesis with summaries and discussions of a number of cases studies of ridership characteristics in operating rail transit systems: Los Angeles, San Diego, Denver, St. Louis, Minneapolis, and San Francisco.
Here are excerpts from some of the PPT slides presenting summaries of statistical data:
♦
♦
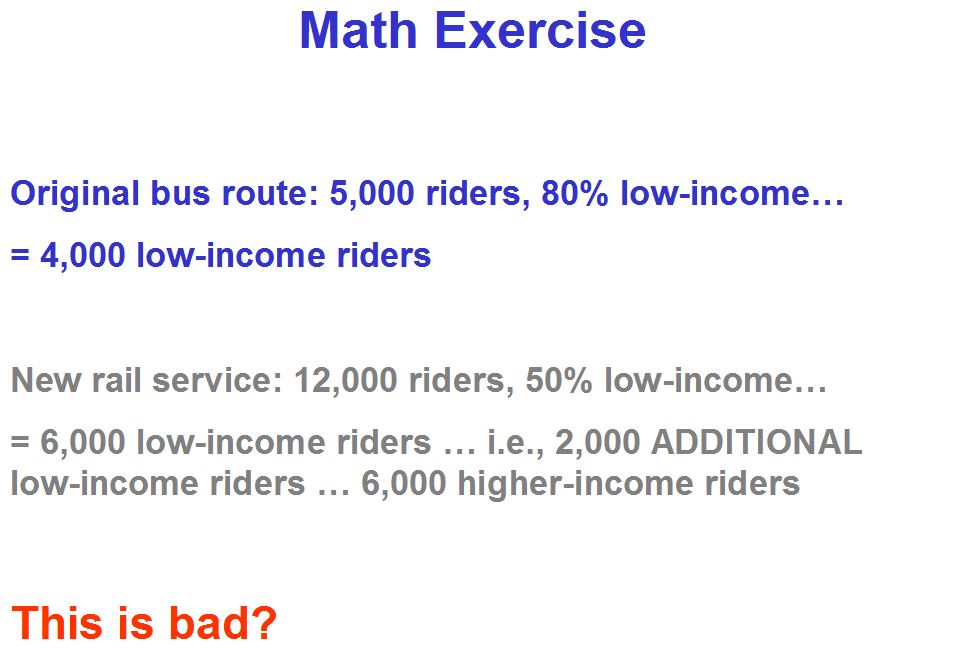
“Math exercise” challenges claim rail transit has class/ethnic bias, based on demographic percentage. Since rail attracts more, and more diverse, ridership, average income rises, but so does lower-income and minority ridership!
♦
♦

Los Angeles — Rail ridership (upper left) is 84% minority, bus ridership (lower right) is 88% minority.
♦
♦

St. Louis is one example for which study data was available. Metrolink light rail transit system has attracted a more diverse ridership than bus system.
♦
♦
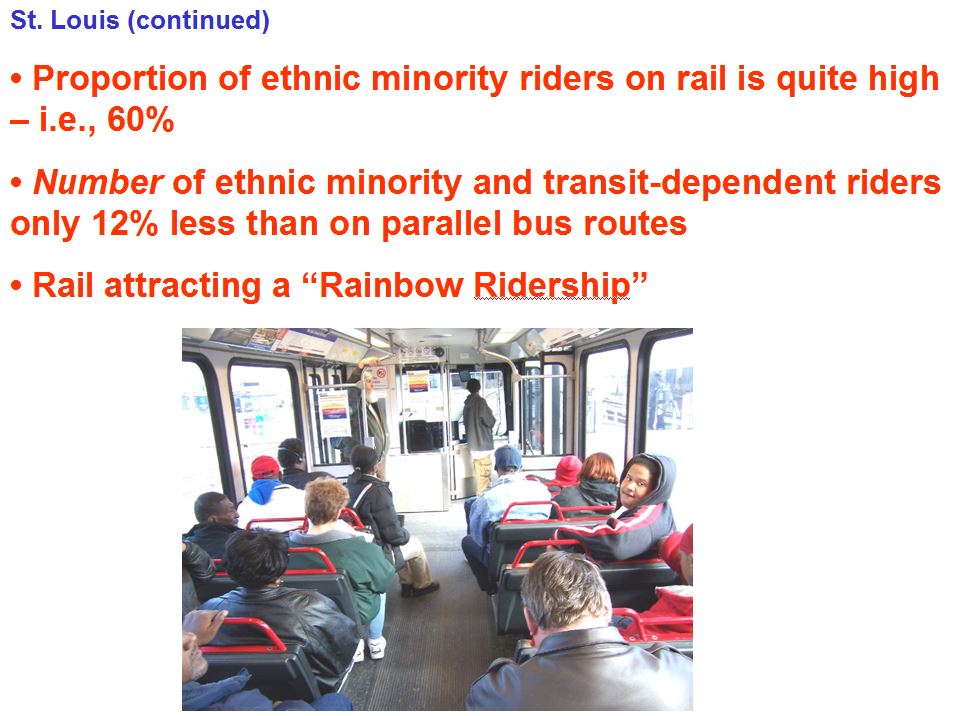
Summary of some study data supporting ethnic diversity on Metrorail system.
♦
♦
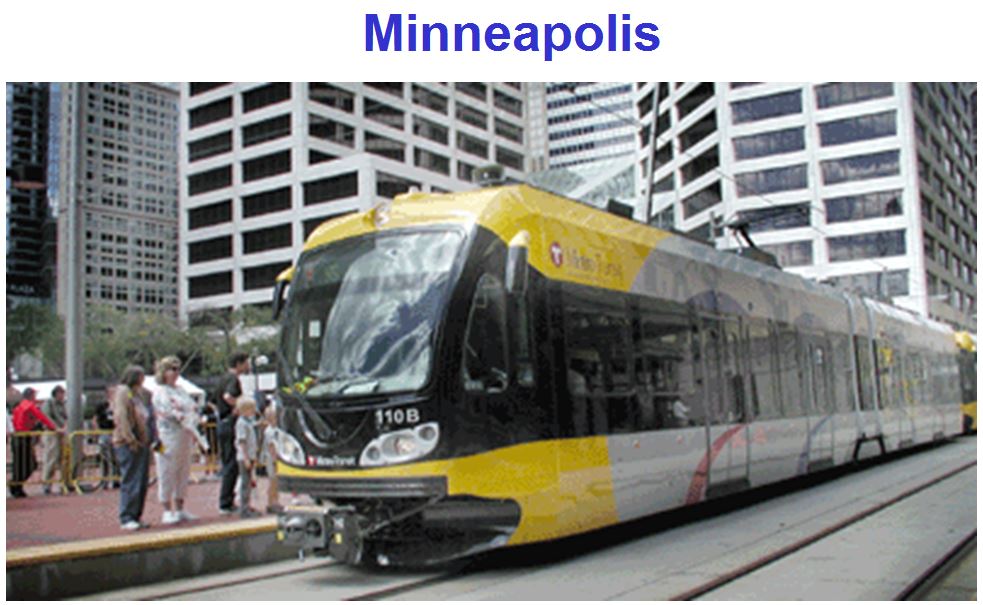
Minneapolis’s Hiawatha light rail system also provided case study with data supporting rail ridership ethnic and income diversity.
♦
♦
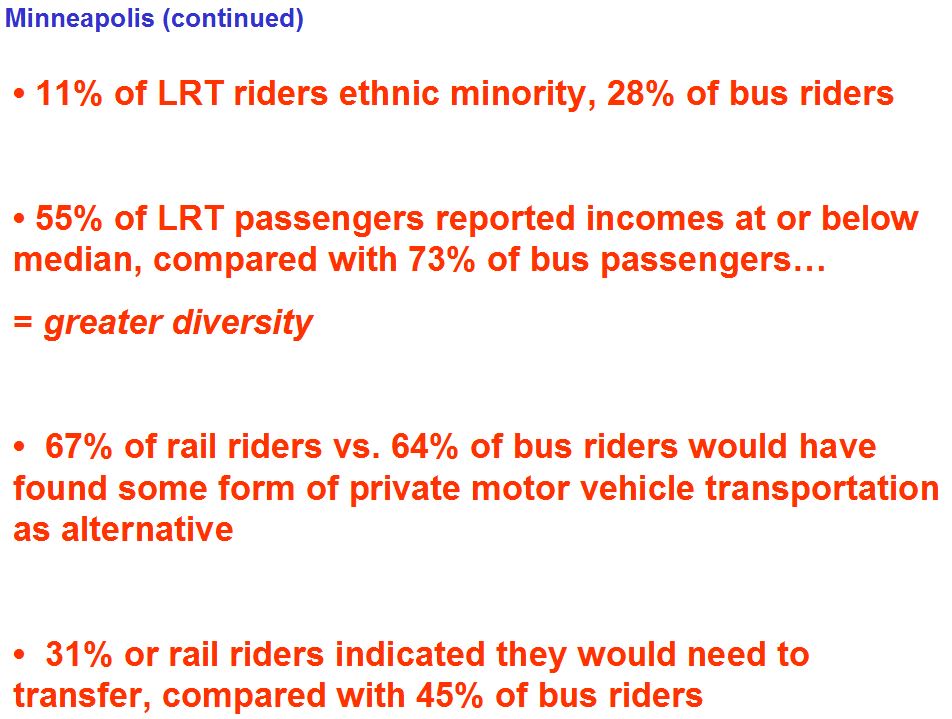
Summary of some study data supporting income/ethnic diversity on Hiawatha LRT system.
♦
♦
From this evidence, the paper concludes:
High-quality transit services, especially rail systems, have demonstrated a marked propensity to attract middle- and higher-income ridership – the very people who would otherwise make up the majority of automobile users, clogging freeways and streets and contributing to an increased need for expansive roadway expansion and construction of parking facilities. In particular, the evidence suggests that higher-quality transit operations — particularly rail transit – tend to effectively serve two somewhat disparate transit passenger markets with two different types of service needs: (1) a basic, affordable service for transit-dependent travelers, including many lower-income, and (2) a high-quality service capable of attracting more affluent urban and suburban travelers out of their motor vehicles, thus helping to alleviate dependency on private motor vehicle transportation and to reduce demand for peak roadway and parking capacity. Overall, evidence suggests that high-quality transit service improvements tend to meet the needs of both categories of travelers with considerable success.
Thus, the research reported in this paper suggests that these types of higher-quality transit service actually produce a far more diverse ridership than is experienced with typical bus services alone. In effect, far from promoting inequity, the evidence suggests that these kinds of transit services foster a “rainbow ridership”, promoting passenger diversity within the nation’s transit systems.
The main takeaway from the paper can probably be boiled down to this: Rail transit tends to attract significantly more riders than buses, and from a much wider diversity of income levels and ethnic backgrounds. Be sure to read the complete paper to become fully informed on this critical issue.